
Cryptocurrency prices have started the week well, with Bitcoin soaring above $62,000 for the first time since July 2nd. It has soared for four straight days and jumped by almost 20% from its lowest point this month.
This rally is because Germany’s Saxony state has concluded dumping its Bitcoin holdings in exchanges and is now selling them.
Bitcoin’s rally has triggered a rebound of most altcoins, with BILLY, Michi, Mother Iggy, and JasmyCoin (JASMY) rising by double digits. Our crypto chart of the week is Jasmy, which is nearing a crucial technical level.
JasmyCoin formed a hammer chart pattern
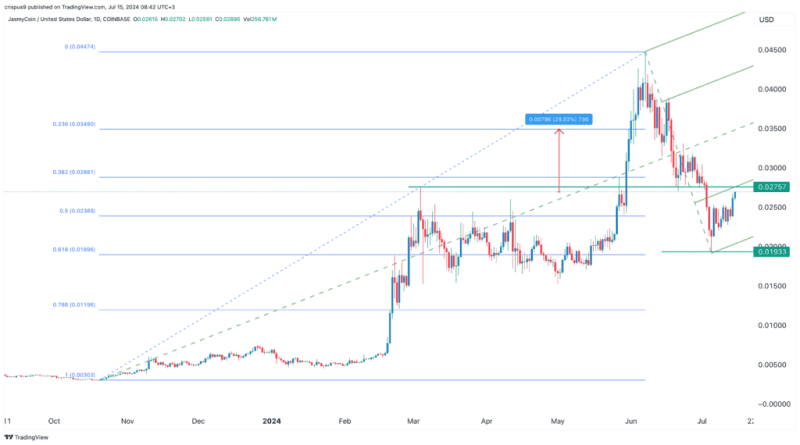
JASMY price chart
The first important thing is that Jasmy token formed a hammer chart pattern whose lower side was at $0.0193. In most cases, hammer is one of the most bullish candlestick patterns in the market.
When it happens, it is usually a sign that an asset in a freefall is about to have a bullish reversal, which explains why the token has bounced back. The lowest side of the hammer coincided with the 61.8% Fibonacci Retracement level.
The other important technical aspect is that Jasmy is approaching an important resistance point at $0.02757, its highest point in March 2024. This was also an important level since it is at the first support level of the Andrew’s pitchfork tool.
Therefore, a move above that level will point to more upside for the Jasmy token, with the next point to watch being the 23.6% retracement point at $0.35. If this happens, the token will rise by about 30% from the current level.
JASMY price technical indicators
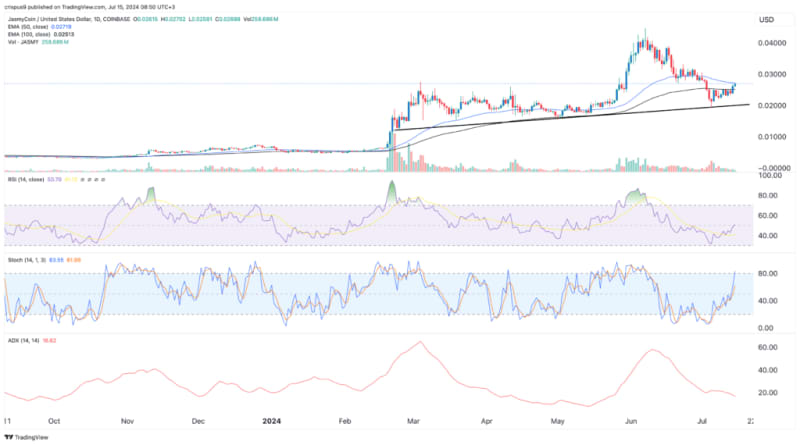
Meanwhile, the daily chart shows that the JASMY token has crossed the 100-day Exponential Moving Average (EMA). It has also found some resistance at the 50-day moving average. This recovery will be confirmed if the JASMY token price rises above the 50-day moving average.
Meanwhile, oscillators are all pointing upwards. The Relative Strength Index (RSI) has moved from the oversold level of 39 and has moved to the neutral level of 50. The RSI is an important oscillator that measures the rate of change of an asset. A rising RSI is usually a sign that an asset is having a bullish momentum.
The Stochastic Oscillator, on the other hand, has jumped and is nearing the overbought point of 80. Like the RSI, the stochastic oscillator is a momentum tool that rises when an asset is gaining strength.
However, the Average Directional Index (ADX), one of the most popular trend oscillators, has pointed downwards. A trend is said to be strong when the ADX indicator moves above 20 and is pointing upwards. The volume indicator shows that it has been falling in the past few weeks, which is a red flag.
Trading considerations for Jasmy token
Therefore, with these data points paint a different outlook for the JASMY token. While this could be a strong rebound, there is also a risk that it could be a dead cat bounce. In price action analysis, a dead cat bounce is a situation where an asset rebounds briefly and then resumes the downward trend.
In this case, the next key level to watch will be at $0.02747, its highest point on March 4th. A volume-supported move above that level will point to more upside, with the next point to watch being the psychological level at $0.030.
The alternative scenario is where the JASMY token price resumes the downward trend if Bitcoin loses momentum. If this happens, the token will likely drop to the key support level at $0.020.
The post Crypto chart of the week: JASMY token nears a pivotal price appeared first on Invezz